
Trafford's average home hit a record £396,811 in June, up 9.7% in a year: joint 9th fastest of 295 English districts, and the quickest in Greater Manchester.
The average home in Trafford sold for £396,811 in June, the highest figure the official index has ever recorded for the borough, and up £34,944 on the same month a year earlier.
That is a rise of 9.7 per cent in twelve months. England as a whole managed 1.8 per cent. The figures come from HM Land Registry’s UK House Price Index, released on 19 August.
Joint ninth of 295
We downloaded the full UK House Price Index file for June, which carries every local authority in the country, and ranked all 295 English districts on annual change. Trafford came joint 9th, level with Harborough in Leicestershire.
Sixty-two of those 295 districts fell over the year.
What makes Trafford’s position unusual is not the speed. It is the price. Fast growth is normally a cheap-area story: buyers priced out of somewhere expensive move outward, and a low base makes the percentage look dramatic. The eight districts above Trafford include Hyndburn at an average of £138,818 and Burnley at £134,515.
Trafford is the dearest area in England’s top 20 risers. Only three English districts are both more expensive than the England average of £293,262 and up 9 per cent or more:
- Derbyshire Dales, £353,364, up 11.7 per cent
- Harborough, £345,848, up 9.7 per cent
- Trafford, £396,811, up 9.7 per cent
Fastest in Greater Manchester, and the dearest
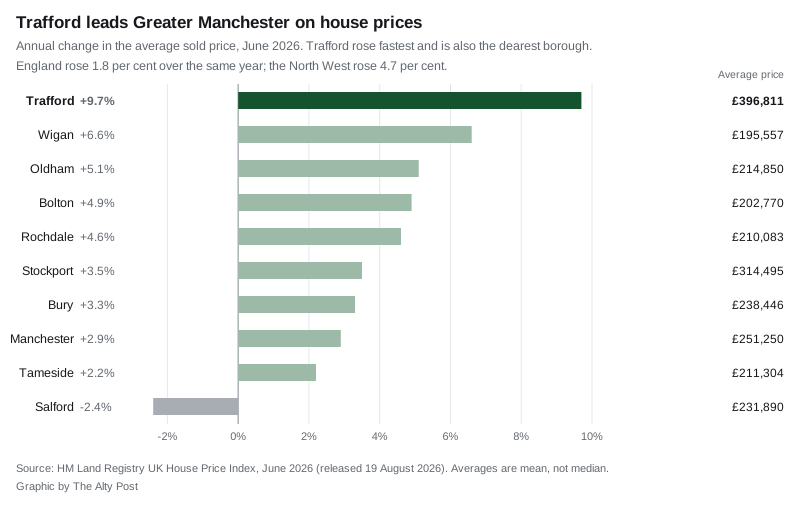
Trafford rose faster than any of the other nine Greater Manchester boroughs, and it was already the most expensive of them. Stockport is second on price at £314,495, some £82,316 behind. Salford was the only borough in the conurbation where prices fell.
The cheaper end moved fastest
Within the borough, it was not the big houses that led. Terraced and semi-detached homes rose fastest:
- Terraced: £347,155, up 10.7 per cent
- Semi-detached: £448,945, up 10.5 per cent
- Detached: £800,316, up 8.4 per cent
- Flats: £218,367, up 7.7 per cent
That detached figure is worth pausing on. June 2026 is the first month in the index’s entire run, going back to 1995, in which the average detached home in Trafford has been worth £800,000 or more.
The first-time buyer average also set a record, at £319,681. A year earlier it was £290,094, so the typical first purchase in Trafford now costs £29,587 more than it did last June.
This happened quickly
Six months ago the borough was barely moving. The annual rate has climbed sharply and recently:
- January 2026: up 2.1 per cent
- February: up 1.0 per cent
- March: up 0.6 per cent
- April: up 2.5 per cent
- May: up 5.8 per cent
- June: up 9.7 per cent
Part of that is the comparison month. June 2025 was a weak point for Trafford: the average fell 2.2 per cent that month, to £361,867, and the annual rate then was 0.8 per cent. A soft base flatters this year’s percentage. The record price itself does not depend on the comparison, but the 9.7 per cent does, in part.
Three things to hold in mind
These are mean averages, not medians. UKHPI reports the mean. In a borough that runs from Bowdon to Partington, a small number of very large sales pulls the figure up. The borough average is not “what a house in Altrincham costs”. Our Altrincham house prices page sets out the local ladder in more detail.
The most recent months get revised. May was first published at £393,244, up 6.2 per cent. In the June release it reads £391,768, up 5.8 per cent, a reduction of £1,476. April moved the other way, from £380,181 to £381,156. Any figure for the newest month should be treated as provisional.
Sales volumes lag the prices. The index leaves the volume column blank for the two most recent months, so the latest publishable count for Trafford is April 2026, at 137 sales. Do not compare volumes across spring 2025 either: the stamp duty threshold changed on 1 April that year and distorted the run-up.
What it means for you
If you are selling, the borough has moved in your favour faster than almost anywhere in England, but the gain is concentrated in terraced and semi-detached stock rather than at the top of the market. A June 2025 valuation is now badly out of date.
If you are buying, the practical problem is that the cheaper end moved most. The entry point rose faster than the borough average, and the first-time buyer figure is up nearly £30,000 in a year. Waiting has had a real cost in Trafford in a way it has not in Manchester, where prices rose 2.9 per cent, or Salford, where they fell.
If you are staying put, the borough average is now £103,549 above the England average. That gap is the clearest single measure of what Trafford has become.
Neither figure tells you what any individual street has done. Land Registry publishes actual sold prices for every address, and planning activity across the borough is tracked on our Altrincham planning news page.
Update, 24 September 2026: Land Registry has since revised these figures. In the July release, June 2026 reads £397,325 and 9.8 per cent, rather than the £396,811 and 9.7 per cent published in August, and May reads £392,799 and 6.1 per cent rather than £391,768 and 5.8 per cent. Other districts were revised too, so on the revised June data Trafford ranks tenth of 295 rather than joint ninth. The July figures, in which Trafford ranks first of 295 and the borough averages more than £400,000 for the first time, are in Trafford house prices pass £400,000.
Have your say