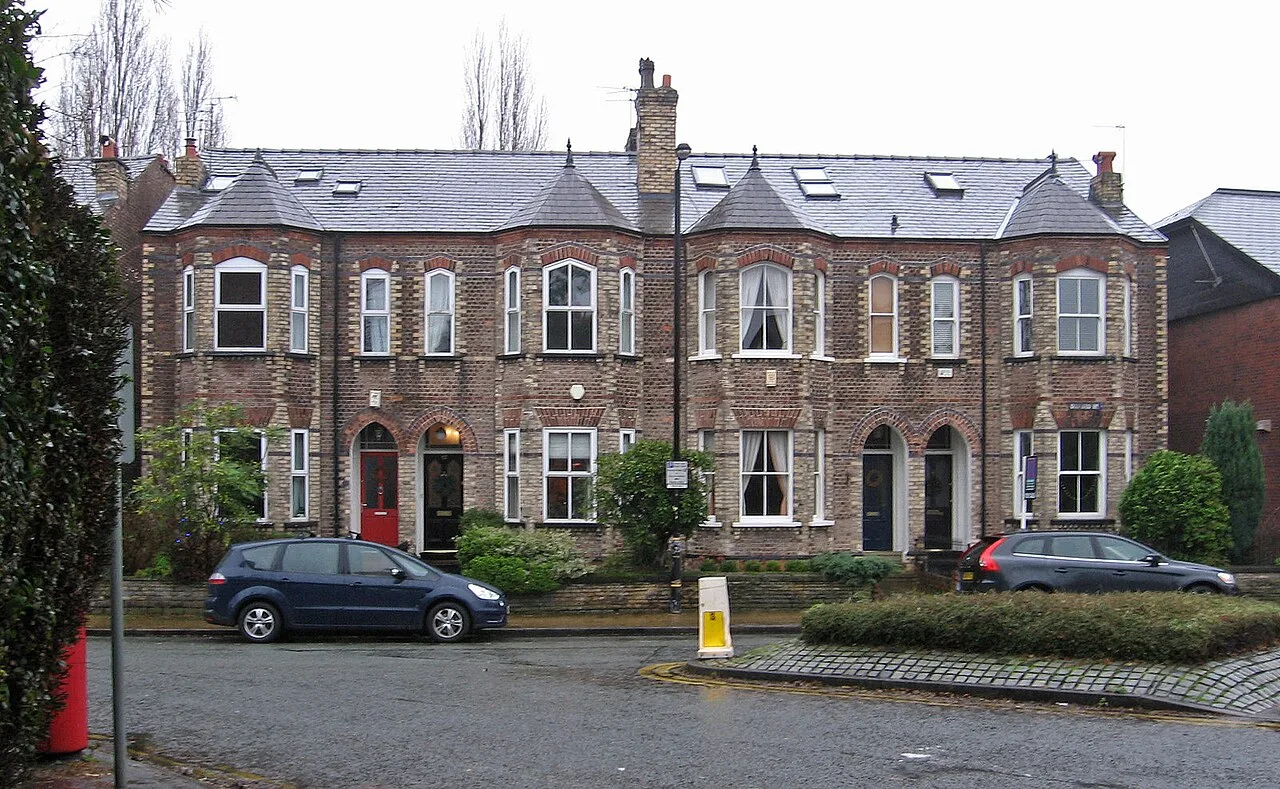

The average Altrincham home sold for £489,400 (Land Registry data). Prices by type, the £1.5m Bowdon roads, and the ladder from Hale down to Stretford.
What an Altrincham house is “worth” depends on which number you read. Asking prices are hopes; the figure that matters is what buyers actually paid, which HM Land Registry records when each sale completes. This page reads those sold-price figures plainly: the town and borough averages, what each property type goes for across Trafford, the roads where sales clear £1.5 million, and the local ladder from Hale down to Stretford.
The quick answer
The average sold price for a property in Altrincham (the WA14 and WA15 postcodes) is £489,400, based on HM Land Registry data compiled by PropertySolvers for the last rolling year. That is up £6,080 (1.38%) over twelve months and £30,414 (7.31%) over five years: a market that has kept its gains but is climbing gently rather than racing.
The official UK House Price Index puts the Trafford borough average at £396,811 for June 2026, up 9.7% on the year, the highest figure the index has ever recorded for the borough. That covers everywhere from Bowdon to Partington, which is why it sits below the Altrincham town figure. Both numbers point the same way: Trafford is rising well ahead of England as a whole, which managed just 1.8% over the same year, and it remains the most expensive borough in Greater Manchester by a distance. It was also the fastest-rising district in Greater Manchester in June, and joint 9th fastest of 295 in England.
What it means for you
If you are selling, the volume numbers matter more than the average. Altrincham recorded 558 sales in the last year, homes take an average of 111 days from listing to completion, and the typical sale completes about £13,369 (2%) under asking. In June 2026 there were 132 new listings, 103 agreed sales and 82 price reductions, so for every four homes that came to market, roughly two and a half found a buyer and two and a half cut their price. Realistic pricing from day one is what separates the two columns. If you are buying, the borough’s 9.7% annual rise means waiting is not free, and the most-sold band, £286,000 to £392,000 (136 sales), is where the competition concentrates; the £392,000 to £498,000 band is nearly as busy. If you are staying put, your home has gained roughly 1 to 6% in a year depending on where it sits and what it is.
Prices by property type
The UK House Price Index breaks the borough down by type. These are the Trafford figures for June 2026:
- Detached houses: £800,316, up 8.4% on the year. June 2026 is the first month since the index began in 1995 in which the borough’s detached average has reached £800,000.
- Semi-detached houses: £448,945, up 10.5%. The classic Timperley and Sale family home.
- Terraced houses: £347,155, up 10.7%, the fastest riser of the four. Stretford and Old Trafford terraces are the borough’s traditional first move.
- Flats and maisonettes: £218,367, up 7.7%, the clear laggard.
A first-time buyer in Trafford paid an average of £319,681 in June 2026, up 10.2% on the year and the highest the index has recorded, while a home mover (selling one property to buy another) paid £481,811. The £162,000 gap between those figures is, in effect, the size of the step from a first flat or terrace to a family semi in Timperley or Sale.
The local ladder, from Hale to Stretford
One borough, very different markets. Here is the ladder, using the same rolling-year Land Registry sold-price basis for the towns and the June 2026 index for the borough and the benchmarks:
Hale averages £500,000 (up 1.77% on 196 sales, and note the figure covers the wider WA15 postal area, not just the village, whose own streets run far higher). Sale at £454,000 (up 3.06% on 644 sales, the borough’s busiest market) and Urmston at £398,531 (up 2.93%, covering Flixton and Davyhulme too) fill the middle, while Stretford at £265,413 is the borough’s value market, and rising 4.52% as buyers priced out of Chorlton and Sale look one tram stop over. Partington’s sales sample is too small for a reliable town average, so it is left off the ladder.
The most expensive streets
The town’s priciest addresses cluster in Bowdon and the Devisdale, on the western edge of Altrincham, according to sold-price records compiled by PropertySolvers:
- Bowdon Road (WA14): £1,588,333 average across three sales.
- Chomlea, Devisdale Road (WA14): £1,575,400 across ten sales.
- Grey Road (WA14): £1,450,000 across three sales.
Cross into Hale and the numbers climb again. The Hale street records are the borough’s peak: Barrow Lane at £3,963,333, two stretches of Carrwood at £3,120,000 and £2,981,593, Glentwood at £2,876,000 and Bankhall Lane at £2,865,000. This is the footballer belt, and it prices like it.
At the other end, the cheapest recorded Altrincham addresses are flats: Regent Court on Groby Road averaged £89,434 across sixteen sales, and blocks on Manchester Road recorded averages under £105,000. The spread between the two ends of the same town is nearly £3.9 million, which is why “the Altrincham average” on its own tells you very little about any one street.
How Altrincham compares
Trafford sits £103,000 above the England average (£293,262) and £177,000 above the North West average (£219,922) on the June 2026 UK House Price Index. It is comfortably the most expensive borough in Greater Manchester: Stockport is next at £314,495, with the city of Manchester at £251,250, Bury at £238,446 and Salford at £231,890. Cheshire East next door, which includes Wilmslow and Alderley Edge, averages £303,387 and still sits £93,000 below Trafford.
The pull is not hard to explain: the borough combines a tram into central Manchester every few minutes with the grammar schools, the market-house food scene that remade the town centre after 2014, and the green edge at Dunham Massey and the Bollin valley, which we cover in things to do in Altrincham. Demand from buyers leaving south Manchester lands squarely on WA14 and WA15, and the street-level figures above show what it did to prices there. What gets built next, from Altair by the Interchange to the Civic Quarter, is tracked in our Altrincham planning news.
Frequently asked questions
What is the average house price in Altrincham?
The average home in Altrincham (WA14 and WA15) sold for £489,400 over the last rolling year, according to HM Land Registry data compiled by PropertySolvers. The wider Trafford borough average on the official UK House Price Index was £396,811 in June 2026, a record for the borough.
Are Altrincham house prices going up or down in 2026?
Up, gently at town level and sharply at borough level. Altrincham’s rolling-year average rose 1.38%, while the Trafford borough index rose 9.7% in the year to June 2026, more than five times the England rate of 1.8%. Terraces and semis are rising fastest; flats lag. The borough rate climbed quickly, from 0.6% in the year to March to 9.7% in the year to June.
How much is a semi-detached house in Altrincham?
Across Trafford, a semi-detached home averaged £448,945 in June 2026, up 10.5% on the year. In the WA14 and WA15 postcodes specifically, semis regularly sell well above that borough figure; detached homes across the borough averaged £800,316.
Where are the most expensive houses in Altrincham?
Bowdon and the Devisdale hold the town’s records, with Bowdon Road, Chomlea on Devisdale Road and Grey Road all averaging £1.45 million or more. Over the border in Hale, Barrow Lane and Carrwood average £3 million to £4 million, the highest sold prices in Greater Manchester.
Is Altrincham the most expensive place in Greater Manchester?
Effectively yes. Trafford is the region’s most expensive borough at £396,811, around £82,000 ahead of second-placed Stockport, and the Altrincham, Hale and Bowdon corner is the most expensive part of Trafford.
Where can I check what a specific house sold for?
Every completed sale in England and Wales is public. Look up any street or address free on the HM Land Registry Price Paid service, or browse the same data on Rightmove and Zoopla.
Sources
- UK House Price Index, Trafford (HM Land Registry) for the borough average, property-type, buyer-type and annual-change figures (June 2026).
- PropertySolvers Altrincham house prices (HM Land Registry data) for the town average, sales volume, days to sell, asking-price gap, June 2026 market activity and street records.
- PropertySolvers town pages for Hale, Sale, Urmston and Stretford.
- UK House Price Index regional data for England, the North West, Manchester, Stockport, Bury, Salford and Cheshire East (June 2026).
- HM Land Registry Price Paid search to check any individual address.
Figures are provisional and revised as more sales complete; rolling-year town figures and monthly index figures cover slightly different windows. Always confirm the latest numbers against the linked HM Land Registry sources before making a decision. Checked August 2026.
Have your say