
Trafford's average home hit £400,688 in July, its first month ever above £400,000, and the fastest annual rise of any of England's 295 districts.
The average home in Trafford sold for £400,688 in July. It is the first time the borough has ever passed £400,000 on the official index, and it makes Trafford the fastest rising housing market in England.
Prices were up 9.6 per cent on July 2025, when the average was £365,524. That is £35,164 in a year. England as a whole managed 1.1 per cent, and the United Kingdom 1.4 per cent. The figures come from HM Land Registry’s UK House Price Index, released on 16 September.
First of 295
We downloaded the full UK House Price Index file for July and ranked every English district on annual change. Trafford came first of 295.
A month ago it was joint ninth. Nothing dramatic happened to Trafford in July: the borough added 0.8 per cent on the month. What changed is that the districts ahead of it fell away. Preston led the June table on 13.3 per cent and reads 7.3 per cent in July. Northumberland was second on 12.3 per cent and is now on 7.3 per cent too.
Eighty-five of the 295 districts fell over the year.
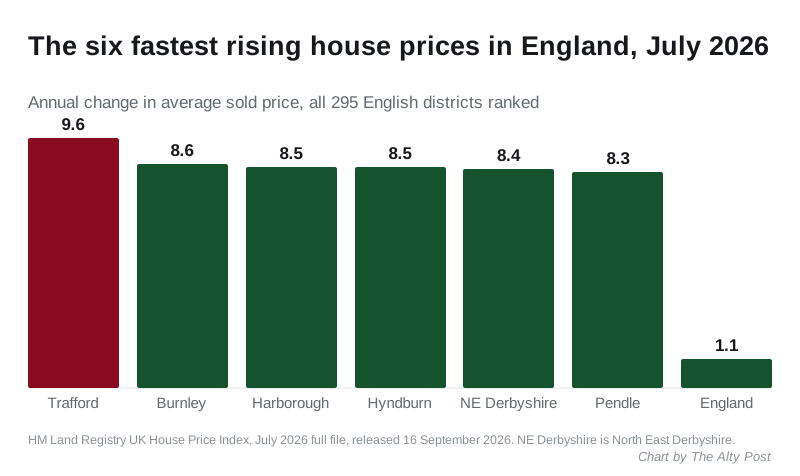
The interesting part is the company Trafford keeps. Fast growth is usually a cheap-area story, because a low base makes the percentage look big. Burnley in second place averages £135,012. Hyndburn, in joint third, averages £141,430. Harborough in Leicestershire, also joint third, is the only other one above the England average price of £293,479.
Trafford is the only English district that is both dearer than the England average and up 9 per cent or more. It is also, at £400,688, the most expensive place in the top 20 risers by a distance.
The £400,000 line
The index runs back to January 1995, which is 379 months of data for Trafford. July 2026 is the only one of them above £400,000.
The previous round numbers give a sense of the pace:
- first month above £300,000: August 2020
- first month above £350,000: May 2022
- first month above £400,000: July 2026
The climb this year has been steep and recent. The annual rate was 1.8 per cent in January and 0.6 per cent in March. It reached 6.1 per cent in May, 9.8 per cent in June and 9.6 per cent in July.
Semis and terraces are still leading
Within the borough it is not the big houses driving the number:
- Semi-detached: £453,584, up 10.7 per cent
- Terraced: £351,164, up 10.5 per cent
- Detached: £807,179, up 9.4 per cent
- Flats: £219,596, up 6.7 per cent
Detached homes also set a record: £807,179 is the highest the index has recorded for a detached house in Trafford, and the second month in a row above £800,000.
The first-time buyer average reached £322,805, another record, and £28,905 more than in July 2025.
Trafford against its neighbours
Trafford is both the dearest borough in Greater Manchester and the fastest rising. The gap has widened:
- Trafford: £400,688, up 9.6 per cent
- Stockport: £317,913, up 4.2 per cent
- Bury: £242,437, up 2.8 per cent
- Manchester: £252,309, up 1.2 per cent
- Salford: £229,462, up 0.3 per cent
- Tameside: £209,723, down 0.1 per cent
Stockport, the next dearest, is £82,775 behind. Tameside was the only Greater Manchester borough where prices fell over the year. The North West as a whole averaged £221,445, up 4.4 per cent.
Three things to hold in mind
These are mean averages, not medians. UKHPI reports the mean, so a small number of very large sales pulls the figure up. In a borough that runs from Bowdon to Partington that matters. The borough average is not what a house in Altrincham costs, and it is not what a house in Stretford costs. Our Altrincham house prices page sets out the local ladder.
Recent months get revised, and this month’s did. In the June release, June read £396,811 and 9.7 per cent. In the July release it reads £397,325 and 9.8 per cent. May moved from £391,768 to £392,799, and its annual rate from 5.8 per cent to 6.1 per cent. Treat the newest month as provisional: July’s £400,688 will almost certainly be restated next month.
Sales volumes lag. The index leaves the volume column blank for the two most recent months, so the latest publishable count for Trafford is May 2026, at 188 sales. Volumes have been thin all year: 218 in January, 180 in February, 201 in March, 153 in April.
What it means for you
If you are selling, the borough has moved further in your favour than anywhere else in England over the past year, and the gain is concentrated in semi-detached and terraced homes rather than the top of the market.
If you are buying your first home, the typical first purchase in Trafford now costs £322,805, up £28,905 in a year. That is a deposit-sized increase in twelve months, and it is rising faster than the borough average in percentage terms.
If you are staying put, the number that actually reaches you is the council tax band, and bands are still set on values from April 1991, not today’s. Nothing in this release changes yours. Our Trafford council tax bands page explains what each band costs this year.
And if you are watching for the next move, the August index is due in October. June’s 9.8 per cent ran off a weak June 2025, and July 2025 was soft too at 0.9 per cent. Those easy comparisons run out shortly, so a fall in the annual rate would not mean prices had fallen.
Sources
- HM Land Registry UK House Price Index, Trafford, July 2025 to July 2026 for the borough average, the annual change and the figures by property type.
- UK House Price Index full file, July 2026 for the ranking of all 295 English districts, the Greater Manchester comparison, the first-time buyer average, the sales volumes and the full series back to January 1995.
- UK House Price Index for July 2026 for the release date of 16 September 2026 and the UK-wide figures.
- UK House Price Index full file, June 2026 for the previously published June and May figures, used to show the revisions.
Have your say