
The average Trafford home sold for £394,017 in September, up 4.7% on a year. July's £400,688 has been revised to £397,169, just below £400,000.
The average home in Trafford sold for £394,017 in September. That is 4.7 per cent more than a year earlier, when the average was £376,243, a rise of £17,774.
The figures come from HM Land Registry’s UK House Price Index. The September release came out this morning.
Prices rose 0.5 per cent on the month. But the annual rate has roughly halved since the summer, and the borough’s best-known milestone has been revised away.
The £400,000 month that was not
In September we reported that Trafford’s average had passed £400,000 for the first time, at £400,688 in July. That was the figure Land Registry published then.
As more July sales have been registered, the number has come down twice:
- first published, in September: £400,688, up 9.6 per cent
- in the August release, in October: £398,621, up 9.1 per cent
- in today’s release: £397,169, up 8.7 per cent
On the figures as they now stand, Trafford has never averaged £400,000 in any month. July 2026 is still the borough’s highest month on record. We have added a correction to our July story.
The annual rise is slowing
The annual rate peaked in June and has eased every month since. On the latest figures it read:
- June: 9.2 per cent
- July: 8.7 per cent
- August: 5.9 per cent
- September: 4.7 per cent
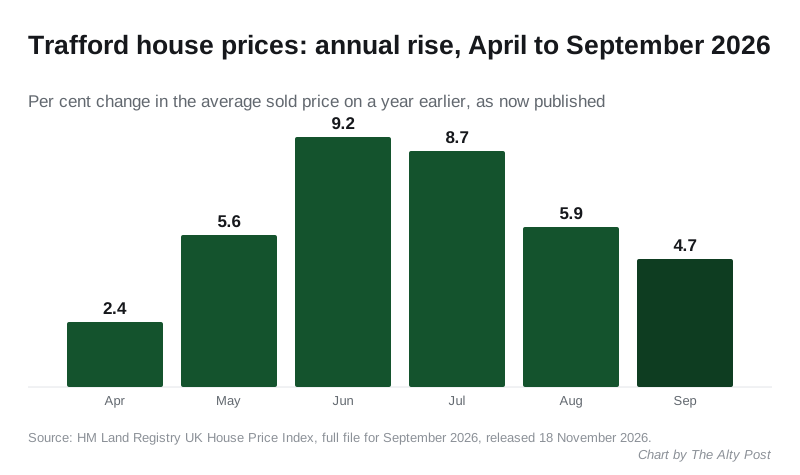
Part of that is arithmetic. Prices rose 1.3 per cent in August 2025 and 1.6 per cent in September 2025, so this year is being measured against strong months. The comparison gets easier from here: October 2025 added 0.3 per cent and November 2025 fell 1.1 per cent.
August this year was weak in its own right. The average fell 1.2 per cent on the month, to £392,241.
Stockport is now rising faster
In the summer Trafford was the fastest rising borough in Greater Manchester. It is now second, behind Stockport:
| Borough | Average, September 2026 | Change on a year |
|---|---|---|
| Trafford | £394,017 | up 4.7% |
| Stockport | £321,895 | up 5.2% |
| Manchester | £254,604 | up 1.4% |
| Bury | £245,206 | up 3.3% |
| Salford | £226,019 | down 1.6% |
Trafford is still the dearest borough in Greater Manchester, £72,122 ahead of Stockport. Salford was the only one of Greater Manchester’s ten boroughs where prices fell over the year. The North West averaged £220,477, up 3.2 per cent. England averaged £292,998, up 0.8 per cent.
We ranked all 295 English districts on annual change using the full index file for September. Trafford comes 27th. Pendle in Lancashire is first, on 9.3 per cent, and 108 districts fell.
By type of home
Every type of home is still up on a year ago, but by much less than in the summer:
- Semi-detached: £446,301, up 5.5 per cent
- Terraced: £345,494, up 5.4 per cent
- Detached: £792,470, up 4.7 per cent
- Flats: £215,448, up 2.3 per cent
The detached average was £800,923 in July and has fallen back below £800,000.
The first-time buyer average was £317,419, up 5.0 per cent. Buyers with a mortgage paid an average of £411,577, and cash buyers £354,958.
Two things to hold in mind
This is a mean average, not a median. A few very large sales in Bowdon or Hale pull the borough figure up. It does not tell you what a house on your street is worth. The average house price in Altrincham runs well above the borough figure.
The newest months will move again. Today’s release shows how far. Land Registry leaves the sales count blank for the two latest months, so the most recent count for Trafford is July, at 253 sales. September’s £394,017 should be treated as provisional.
What it means for you
If you are selling, prices are still higher than a year ago in every part of the market. But the summer pace has gone, and the September average is still £3,152 below July’s.
If you are buying your first home, the typical first purchase now costs £317,419. That is £14,990 more than in September 2025.
If you are waiting for the next figures, the October index is due in mid-December. A fall in the annual rate then would not by itself mean prices are falling.
Sources
- HM Land Registry UK House Price Index, Trafford, September 2025 to September 2026 for the borough average and annual change.
- UK House Price Index full file, September 2026 for the property types, buyer types, monthly series, revised July figure, sales volumes, the Greater Manchester comparison and the ranking of 295 English districts.
- UK House Price Index full file, August 2026 for July as published in October.
- UK House Price Index for September 2026 for the release date.
Have your say